8.1 Student Achievement: The institution identifies, evaluates, and publishes goals and outcomes for student achievement appropriate to the institution’s mission, the nature of the students it serves, and the kinds of programs offered. The institution uses multiple measures to document student success.
To evaluate its effectiveness in supporting student success and achievement, the College tracks the following Key Performance Indicators (KPIs) as part of its strategic goals assessment process: satisfying college readiness standards, successful course completion, persistence, graduation, transfer, and state licensure. For the purpose of evaluation, benchmarks were identified for each KPI to provide a basis for assessing individual goal achievement. In some cases, as noted in the chart below, the benchmark is based upon the average of Texas Higher Education Coordinating Board peer group outcomes data (THECB); while in other cases, the benchmark is based upon the College’s internal data, as appropriate.
Student Achievement
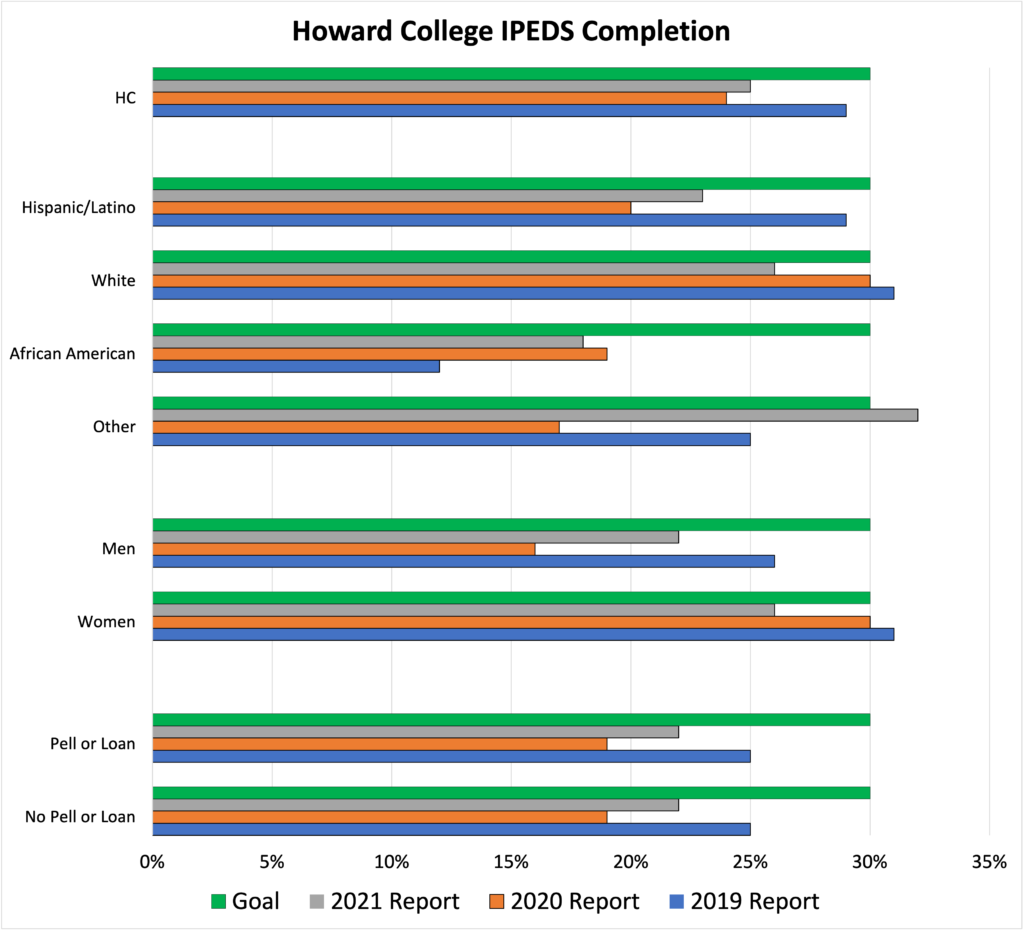
Figure 1. Graduation and transfer-out rates of full-time, first-time degree/certificate-seeking undergraduates withing 150% of normal time to program completion, by campus, race/ethnicity, gender, and type of aid.
Figure 2. Graduation and transfer-out rates of full-time, first-time degree/certificate-seeking undergraduates withing 150% of normal time to program completion, by campus, race/ethnicity, gender, and type of aid.
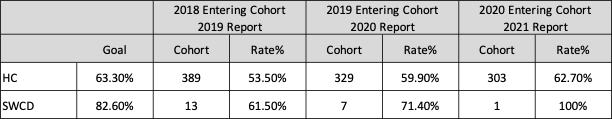
Howard College/SWCD Persistence Rates for the Past Three Years
1-year rate for first-time, degree-seeking undergraduates enrolled in at least 12 semester credit hours in the fall.
Howard College/SWCD Transfer Rates for the Past Three Years
Percentage of first-time in college (FTIC) students who enrolled at Howard College and, were not concurrently enrolled at a 4-year institution, and then transferred for the first time to a 4-year institution within 6 years.
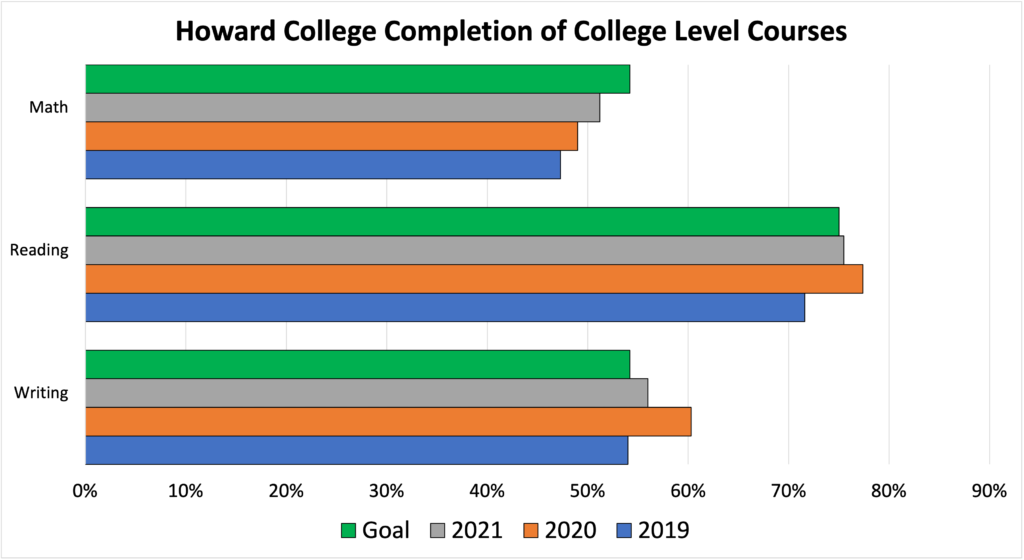
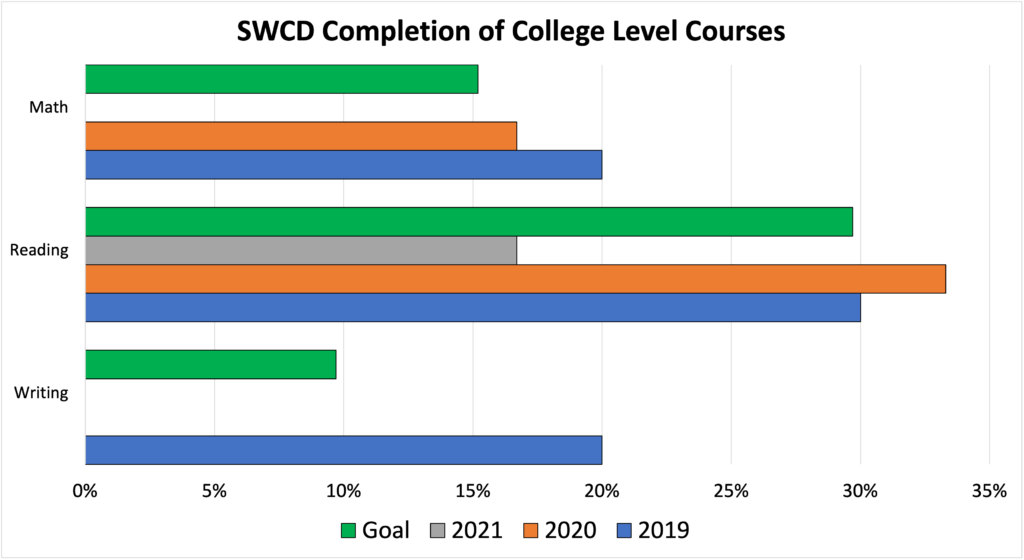
Figure 3. First-time degree seeking students that successfully complete a college-level course in each subject areas (math, reading, writing) within 2 years.
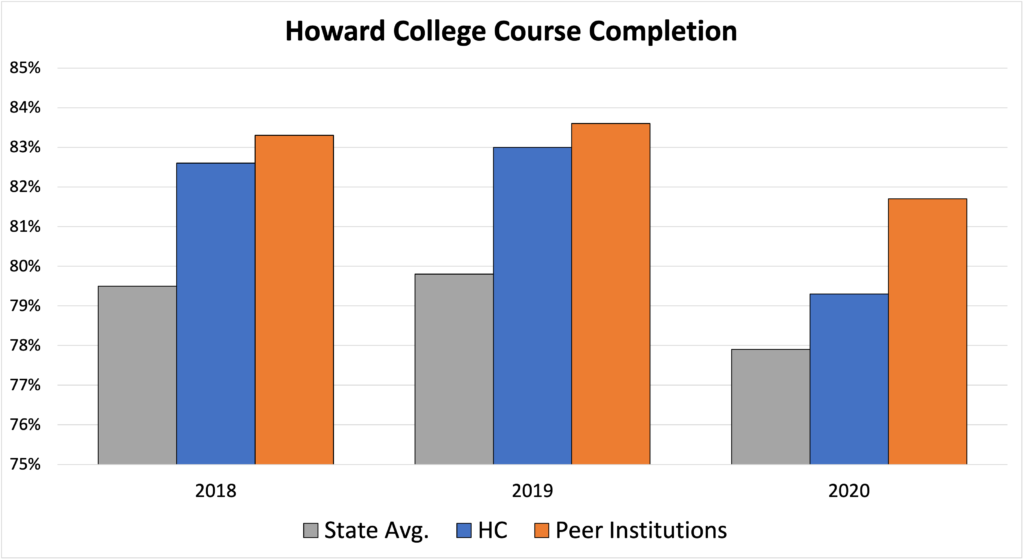
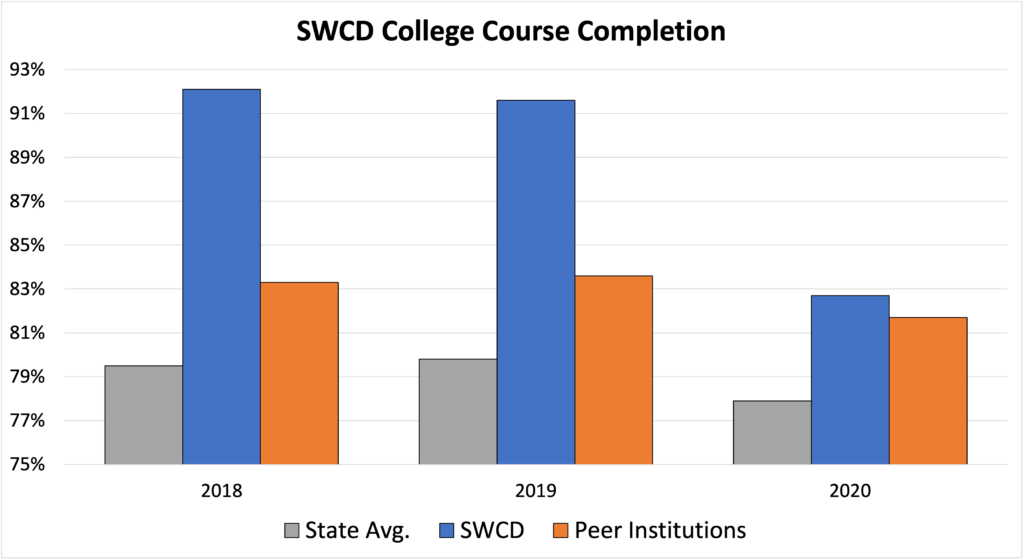
Figure 4. The number of fall semester credit hours completed divided by the SCH attempted. The percentage of attempted SCH that are successfully completed (with grades of A,B, C, D or Credit passed only) are shown.
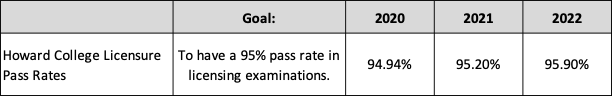
Howard College Licensure Pass Rates for the Past Three Years
The percentage of students in a discipline requiring or offering external certification or licensure who pass a licensure or certification exam during the reporting period.
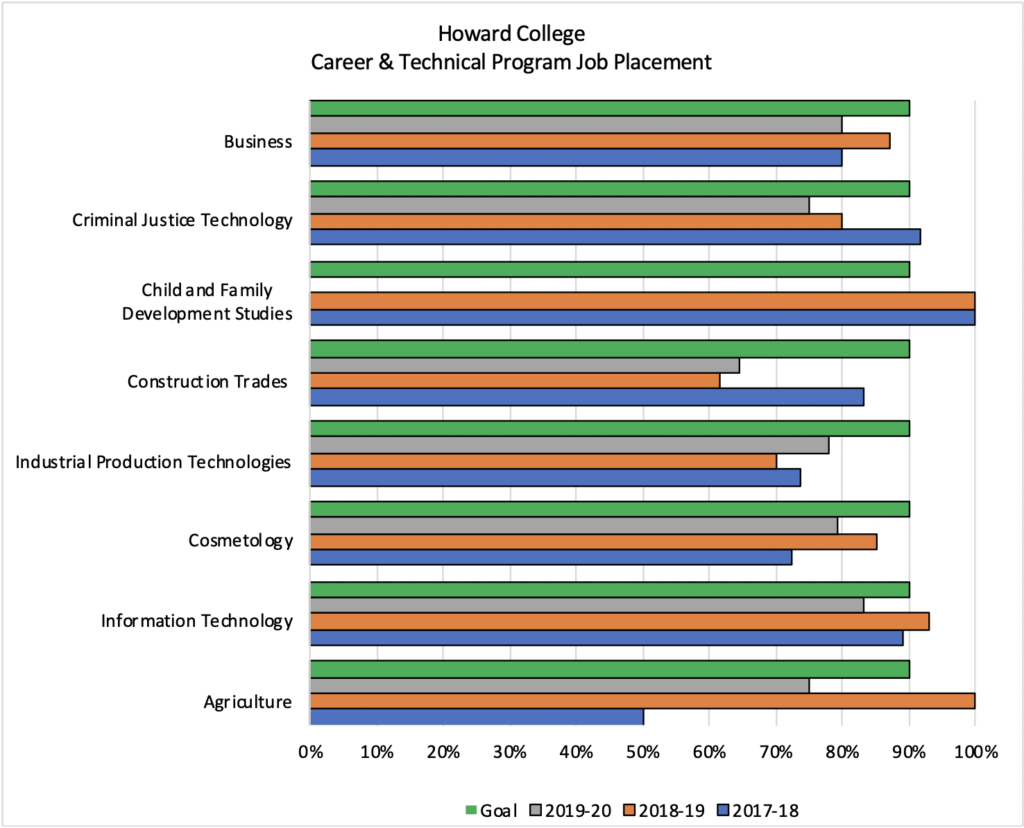
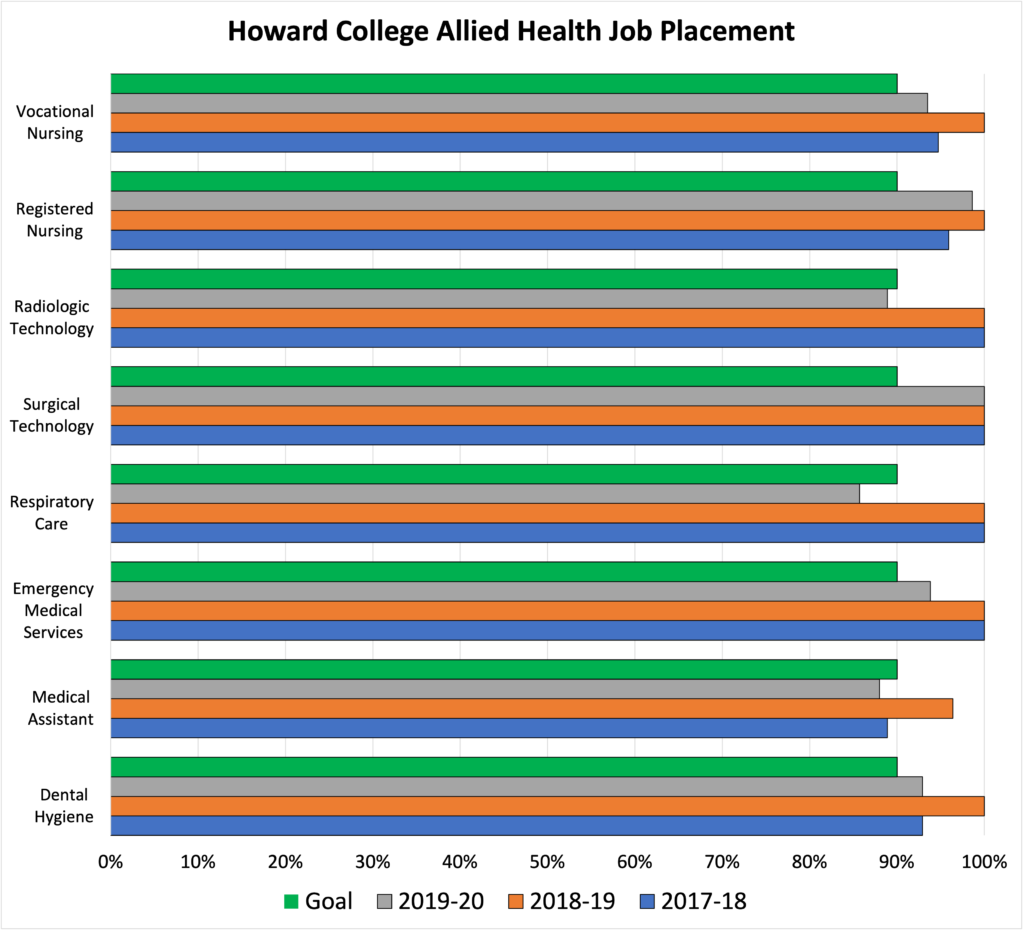
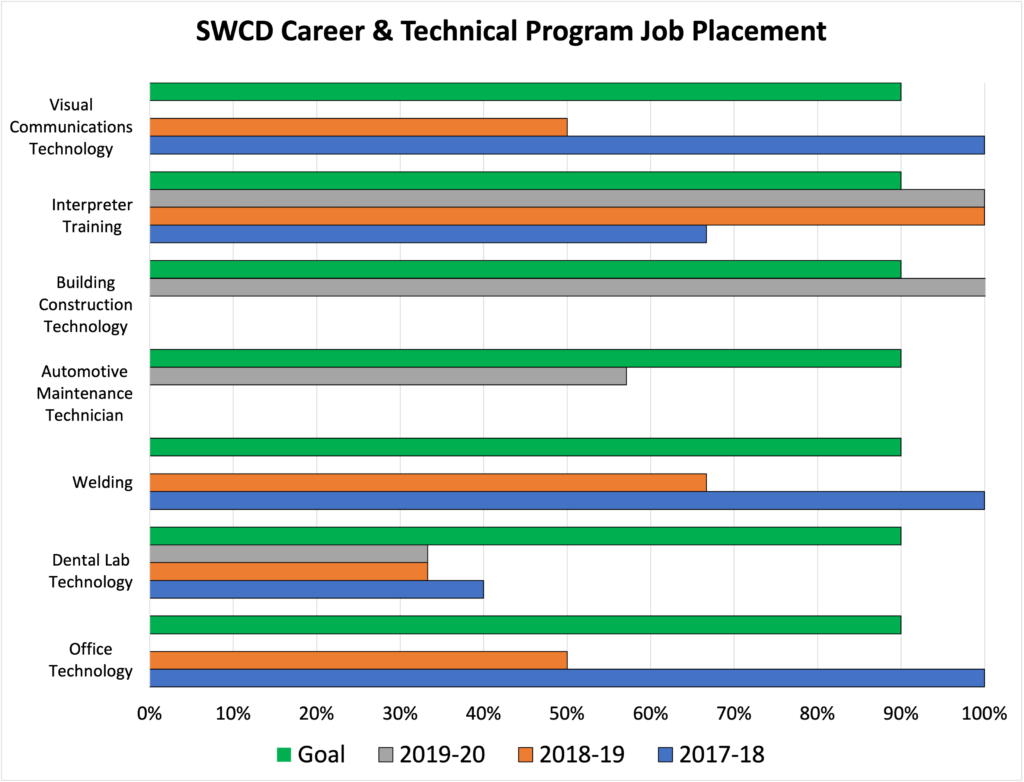
Figure 5. Howard College/SWCD average placement rate of workforce education program completers over 3-year period.
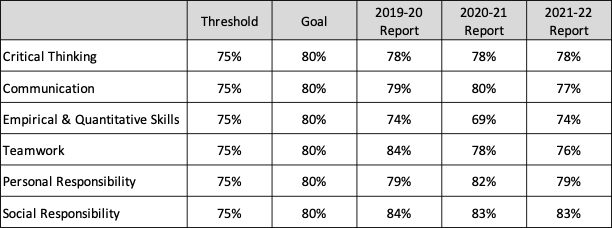
Howard College/SWCD General Education Outcomes
Data Source: U.S. Department of Education, National Center for Education Statistics, Integrated Postsecondary Education Data System (IPEDS), Texas Higher Education Coordinating Board (THECB) Accountability System website. Data for the report was taken from Texas State Data Reports CBM001, CBM002 and CBM00S. 2Howard College institutional data.